UK Favourite Win Rates: Statistical Analysis for Exotic Bettors
 Available in US
The number surprised me when I first calculated it properly. I had assumed favourites won more often. Years of watching market leaders cross the line first had created a perception bias that the actual statistics quickly corrected. Favourites win approximately 30% to 35% of UK races. That means they lose 65% to 70% of the time. For exotic bettors, this single statistic shapes fundamental strategy decisions.
Understanding favourite win rates transforms how you approach wheel construction. The market leader is not a safe anchor for your key horse position. It is a selection that fails more often than it succeeds. That reality demands a more nuanced relationship with favourites than most bettors develop. Sometimes they represent solid wheel anchors. Sometimes they destroy value even when they win. Distinguishing between these scenarios requires examining the data more carefully than a simple headline percentage allows.
Overall Favourite Statistics
The 30% to 35% win rate for favourites represents a long-term average across all UK racing. Flat racing, National Hunt, maidens, handicaps, Group races, and sellers all contribute to that figure. The blend obscures meaningful variation between race types that exotic bettors can exploit.
Conditions races and Pattern company tend toward the higher end of the range. These races feature smaller, more select fields where class distinctions are clearer. The favourite often possesses demonstrated superiority over its rivals. In such contexts, keying the market leader makes reasonable sense because the favourite genuinely has a better chance than the baseline percentage suggests.
Handicaps pull the average downward. The entire purpose of the handicapping system is to equalise chances, theoretically creating dead heats across the field. In practice, favourites still win more than random chance would predict, but at rates closer to 25% in competitive handicaps. These are precisely the races where blindly keying the favourite undermines your wheel bet strategy.
Cheltenham Festival 2024 demonstrated typical festival variance. Favourites won 7 of 21 races, a 33% strike rate that sits comfortably within the expected range. The Grand National winner was sent off favourite that year, but the preceding days saw multiple market leaders beaten. Festival racing concentrates betting volume and sharpens markets, yet still produces favourite success rates that leave most races won by other horses.
Seasonal patterns add another layer. Early flat season sees fewer exposed horses, making form harder to assess. Favourite win rates tend to be lower when the form book offers less guidance. By autumn, established patterns emerge and favourites backed on solid recent evidence win more frequently. If you track your wheel bet results, you may find favourite-keyed bets perform differently in spring versus autumn.
Odds-On Analysis
Odds-on favourites deserve separate consideration because they represent a distinct category. These horses trade at prices below even money, implying a greater than 50% win probability according to the market. The question is whether they deliver on that expectation.
On flat turf, odds-on favourites win approximately 59% of their races. That figure substantially exceeds the general favourite win rate, which makes sense given the market has expressed stronger confidence through shorter prices. A 59% strike rate also means 41% failure. You are still losing more than four times in ten when you key an odds-on shot.
The number of odds-on favourites has increased dramatically over the past decade. Between 2012 and 2022, the annual count rose 37%, from 680 to 931 horses sent off at odds-on prices. This proliferation partly reflects smaller, less competitive fields. When only six horses contest a race and one has vastly superior form, odds-on prices follow naturally. But more odds-on favourites does not mean better value from keying them.
The 41% failure rate at odds-on represents value destruction in wheel bets. When your key horse goes off at 4/5 and wins, the pool payout reflects that short price. The exotic returns compress because the favourite’s victory was priced in. You collect, but the return rarely justifies the risk absorbed. When the odds-on shot fails, your entire wheel collapses. The asymmetry works against you.
My approach distinguishes between odds-on favourites with genuine superiority and those simply benefiting from weak opposition. A Group 1 horse dropping into Listed company justifies odds-on status through demonstrated class. A handicapper at the top of its weight facing moderate rivals might start odds-on due to circumstances rather than genuine domination. The former makes a reasonable wheel key despite short prices. The latter offers poor value regardless of market position.
Implications for Wheel Bets
These statistics generate practical guidelines for wheel construction. The core insight is simple: favourites fail often enough that you must consider alternatives, but they succeed often enough that excluding them entirely creates different problems.
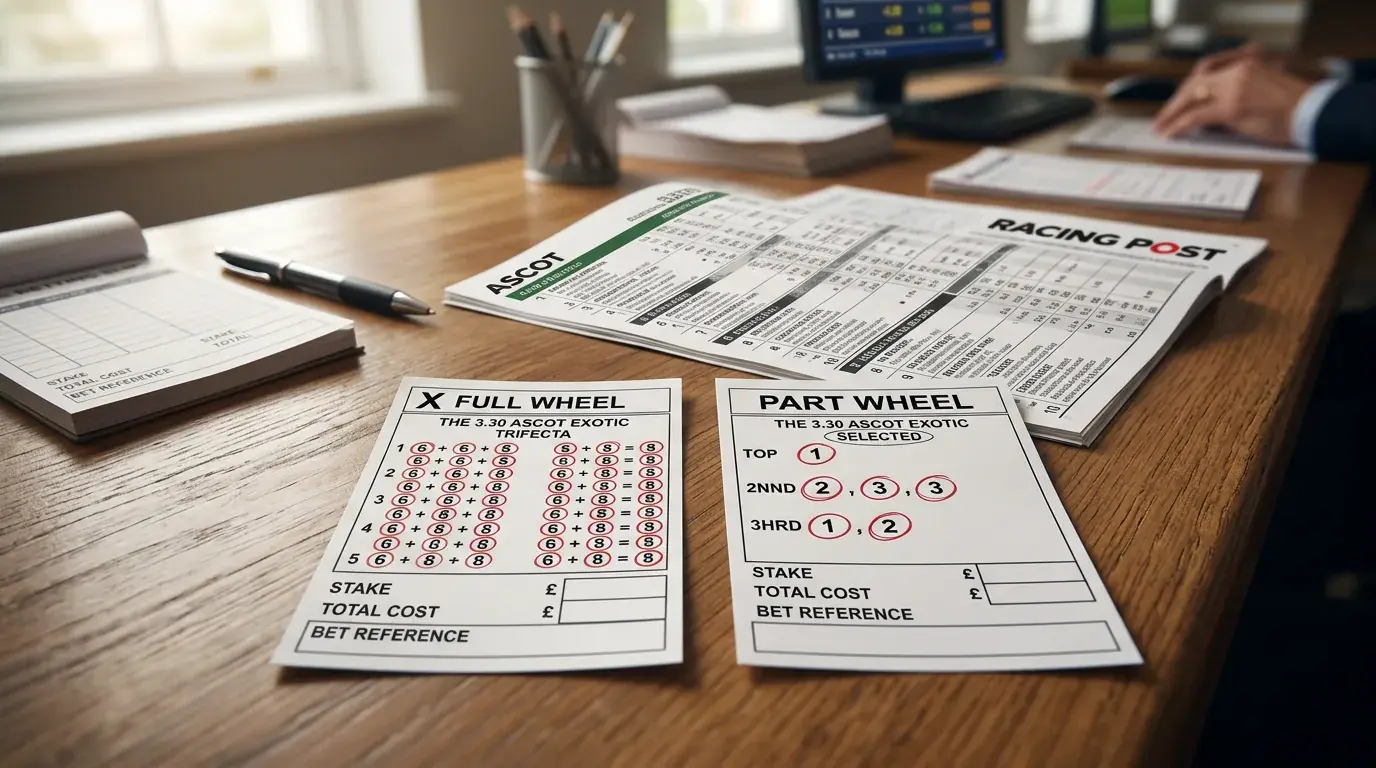
When evaluating the favourite as a potential key horse, ask what happens if it runs to form and finishes second. In many races, the favourite holds a class edge that makes a top-two finish likely even when victory proves elusive. Keying such a horse to win and losing when it finishes runner-up wastes the accuracy of your broader analysis. A part wheel that includes the favourite in secondary positions hedges against this common outcome.
For the complete wheel bet strategy, I recommend treating favourites as candidates rather than defaults. Evaluate them against the same criteria you apply to every other horse: recent form, going preference, distance suitability, course record. If the favourite passes that analysis, it deserves consideration. If it trades short based on reputation or stable strength alone, look elsewhere for your anchor.
Field size affects favourite reliability. In smaller fields of six runners or fewer, the favourite faces less opposition and tends toward higher strike rates. In larger fields of twelve or more, the increased competition and pace variety creates more uncertainty. Adjusting your favourite usage based on field size improves wheel performance across a season.
Finally, remember that win rate does not equal value. A favourite might win 35% of the time but still offer negative expected returns if backed at prices implying 40% probability. The market is efficient enough that favourite win rates and favourite prices roughly balance. For exotic bets, this equilibrium means keying favourites neither systematically helps nor hurts. The value comes from knowing when a particular favourite represents a genuine edge versus a mathematical trap.
Track your own results against favourite-keyed wheels. After fifty or a hundred bets, patterns emerge. You might find certain race types reward favourite keys while others punish them. That personalised data, specific to your selection methods and bet construction, offers more value than any generic statistic.
How often do odds-on favourites win UK flat races?
Odds-on favourites on UK flat turf win approximately 59% of their races. This exceeds the general favourite win rate of 30-35% but still represents a 41% failure rate. That failure rate matters for wheel bets because odds-on key horses destroy value when they lose and compress returns when they win.
Should I always include the favourite in my wheel?
Not always. Include the favourite when your independent analysis supports its market position. Exclude it when the price reflects stable reputation or weak opposition rather than genuine superiority. Many successful wheel bets key horses other than the favourite, especially in handicaps where the favourite win rate drops toward 25%.
Created by the ”Horse Racing Wheel bet” editorial team.